Numbers Don’t Lie, but…
Gregory R. Zinser
Vice President, Anesthesia Business Consultants, Jackson, MI
We’ve all heard the saying “numbers don’t lie,” and while that may be true, if you aren’t looking at the RIGHT numbers presented in a way you can understand, they can be misleading.
For any type of business, the underlying purpose of a reporting system is to provide timely and accurate information to be used by leadership as a basis for making decisions. In most groups, there is no shortage of information in terms of volume, but are you really getting all information you need in a format you can understand? Unfortunately, there is no standard frame of reference. One set of reports may seem adequate until you see a different approach. For most groups, it is difficult to optimize your reporting system and ask the right questions unless you have a member with both a background in financial analysis and time to devote to this task. The purpose of this article is to provide a general perspective on reporting, along with some specific ideas that may help you improve your current reporting system.
There are three common flaws in reporting systems:
- The sheer volume of information presented is overwhelming;
- The presentation format is confusing; and
- Important information is omitted.
Reports that contain huge amounts of information in a confusing format can divert attention from the important information that is not included. They become tools of mass distraction, rather than the essential monitoring and early warning systems they should be.
Report packages should include all information needed to make decisions relating to the clinical, operational and financial aspects of the practice—no more and no less. Collecting information is not time consuming. Reporting all of the available information is not difficult. The real time and work of creating great reports is in the distilling of the detail and design of reports that facilitate review, understanding and discussion. Simply put, great reports will generate the right questions.
 The following guidelines are applicable to all types of reports:
- All amounts should be shown in whole dollars;
- All primary statements should be condensed to fit on one page, using a font size that can be easily read (sub-reports can be used to provide additional detail as necessary);
- All line item titles should provide a clear and concise description of amounts presented; and
- Statements should be available no later than 30 days after the end of a reporting period.
Essential financial reports in most practices would include the following:
- Narrative – All report packages should be accompanied by a narrative that first explains the purpose of each report in the package; lists all underlying assumptions (e.g., accrual vs. cash basis); highlights any key variances or trends in the figures for each statement; and, if applicable, states recommendations for further action to be taken. This narrative is the difference between simple accounting and useful interpretation and analysis. It is also the difference between having an accountant and an advisor. Any accounting service can produce the numbers, but it takes insight and skill to analyze and interpret the data.
- Balance Sheet – Shows all major categories of all assets and liabilities for the most recent month end, the previous month end, and the most recent fiscal year end.
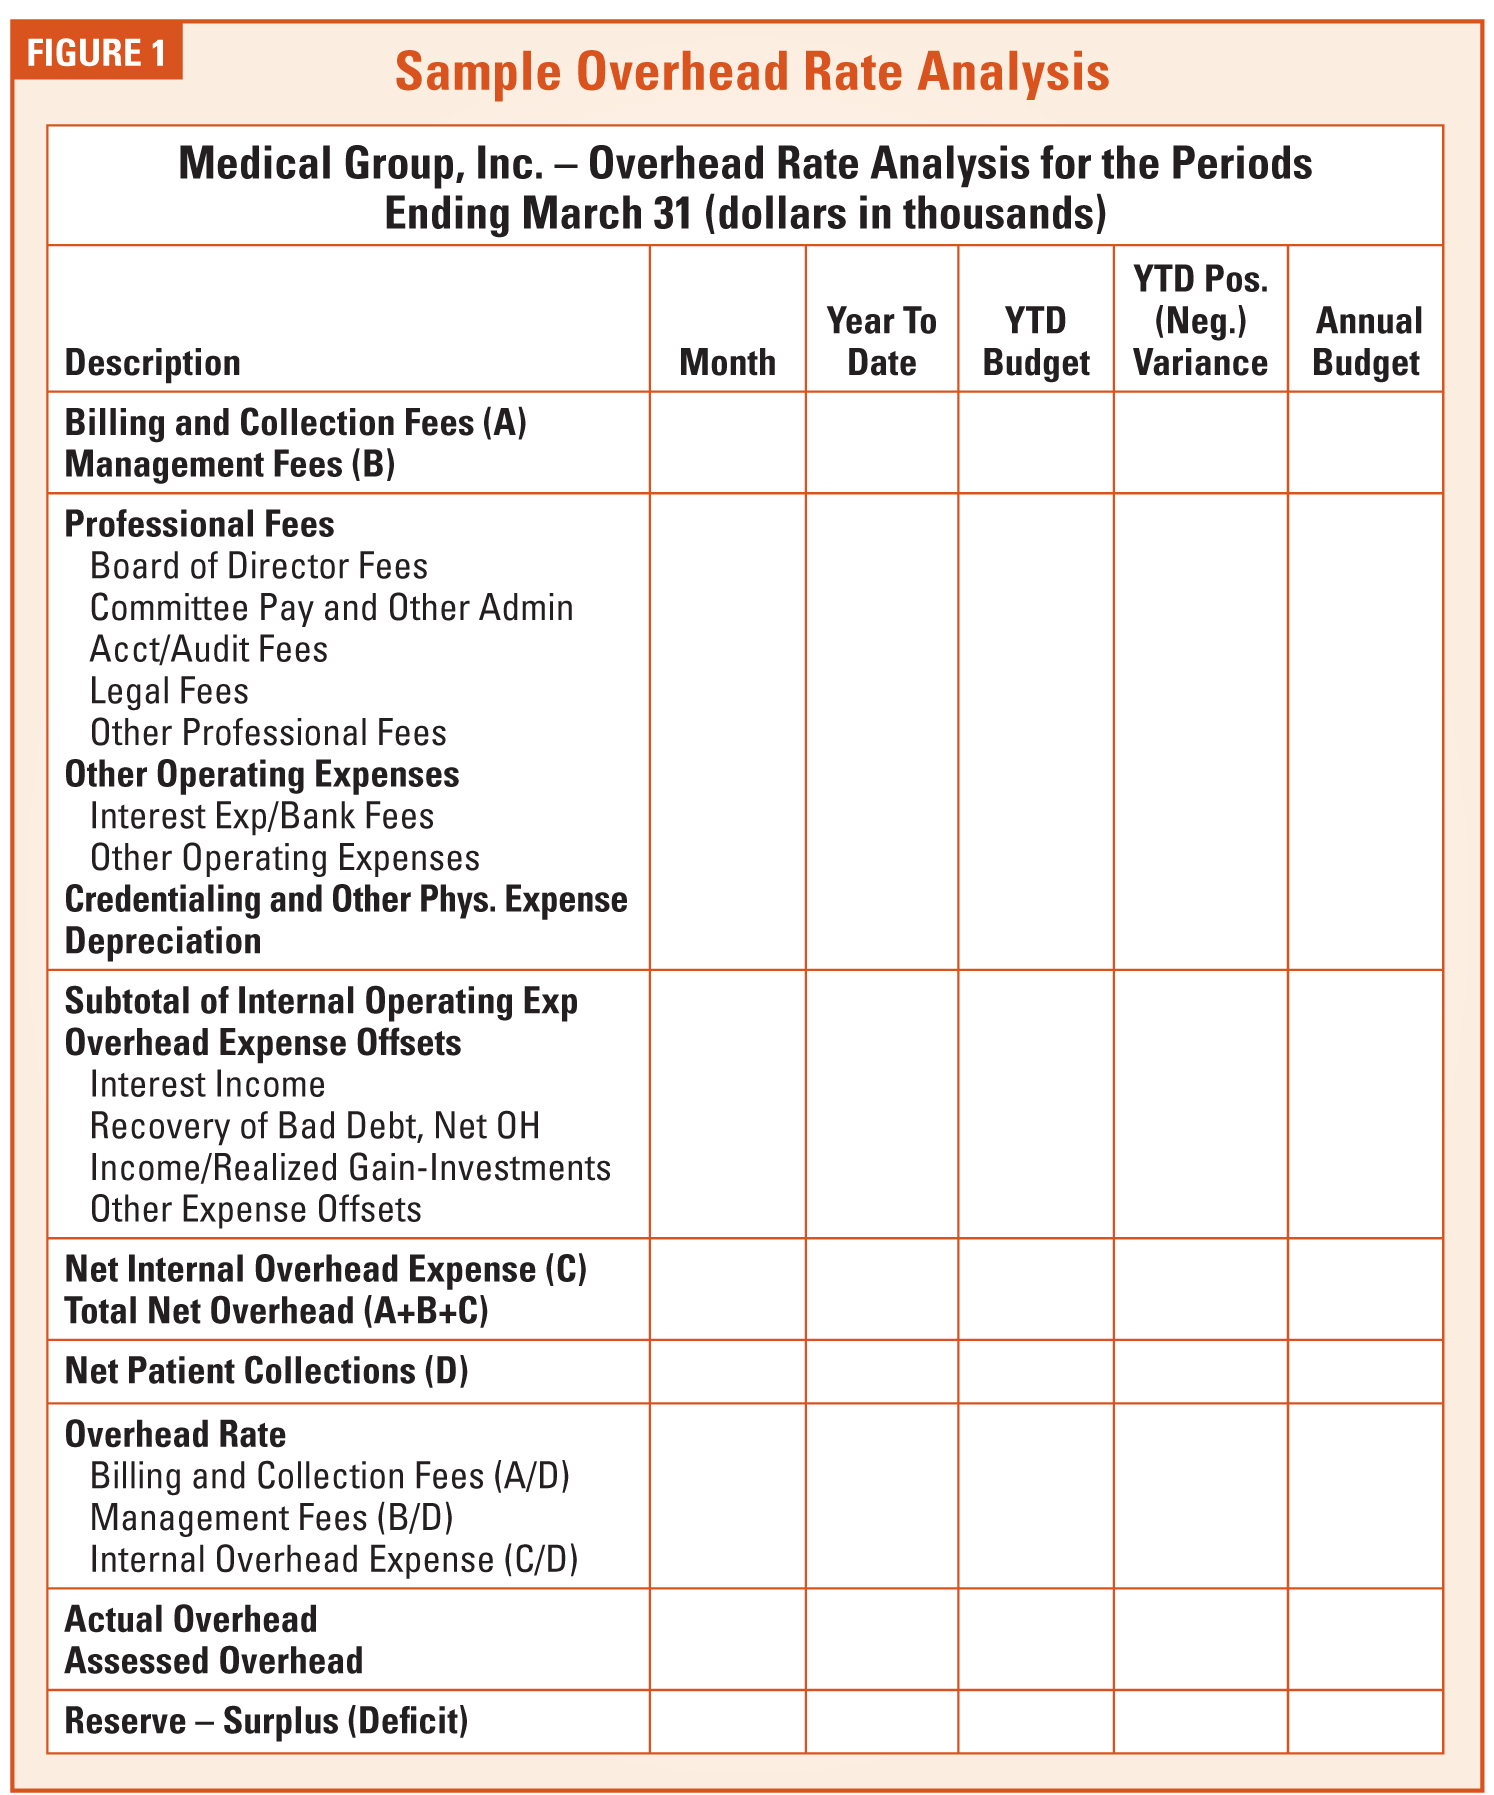
- Income Statement – Shows all major categories of revenue and expenses for the most recent month end, current year to date, year to date actual at the same time last year, current year budget year to date, and a column showing the variance between current year to date actual and budget. In order to fit this statement on one page, all expenses deducted from individual physician compensation are shown as one total, as are all overhead expenses. The subschedule for the former is a simple listing of the detail on one page with all of the same column headings. The subschedule for the overhead expenses is the Overhead Rate Analysis described in Figure 1 on page 15.
- Overhead Rate Analysis (see Figure 1) – Shows all major categories of overhead expense for the current month, and year to date. Year to date figures are compared to year to date budget, and a variance column is also shown. The total annual budget amounts are also shown for each line item. The actual overhead percentage is computed for each of the three major categories of overhead expenses (billing and collection fees, management fees and all other expenses), and is compared to budget and to amounts assessed for overhead year to date. Variances from budget and/or the assessed overhead rate are clearly shown.
Essential operational reports and performance measures in most practices would include the following:
- Net Collection Percentage – Measures how much of what is collectable is actually being collected. The only meaningful way to do this is based on actual results, which means it must be measured no sooner than six months in arrears to be sure that the collection cycle is completed. In addition, all data used for charges and adjustments should be by date of service, with collection amounts directly related to those charges. A sample calculation measuring net collection percentage for the six months ended June 30, 2014, is shown below:
Measurement date of March 1, 2015 for all dates of service from January 1 through June 30, 2014:
Charges $1,000
Contractual adjustments (550)
Other allowable adjustments (50)
Collectible charges $400
Actual collections through March 1, 2015 relating to dates of service from June 1 through June 30, 2014 = $370. Amounts in accounts receivable at March 1, 2015 considered collectible (net) = $20.
Net collections percentage for the six months ended June 30, 2014 = $370+$20/$400 or 97 percent. As is the case with most percentage measures, the statement that can be made about the inverse is just as important as the percentage itself. In this case, the remaining three percent has three components (all relating to dates of service from January 1 to June 30, 2014): 1) bad debt write-offs; 2) amounts in accounts receivable at March 1, 2015 not considered collectible; and 3) non-allowable write-offs such as untimely filing. - Days in Accounts Receivable – Measures how quickly accounts receivable are being collected by calculating the average number of calendar days elapsed from the date charges are posted to the final disposition of the account. Each of the most recent 12 months are shown by major payer category. Also shown for each major payer category is the performance target (if any) and ending AR, both gross and estimated net. A sub-report also shows the same information for more detailed payer categories.
- Accounts Receivable Aging – Classifies outstanding accounts receivable balances by current responsible payer into aging categories based on the date of posting. Accounts receivable balances are not re-aged as partial payments are received, and the aging should not include credit balances. Also shown is the self-pay component of total dollars in each major payer category; and for the four most recent months, the percentage of accounts over 120 days old as compared to the established target (if any). A sub-report also shows the same information for more detailed payer categories.
- Credit Balances in Accounts Receivable – A separate aging of credit balances in accounts receivable is shown by major payer category. A sub-report also shows the same information for more detailed payer categories.
- Collection Agency Performance – For each of the most recent three months and the most recent calendar year, this report shows the collection percentage of accounts transferred to collection agencies, net of collection agency fees. For each period reported, these reports will also show the aging of accounts transferred, the average time between transfer and collection and the total number and amount of accounts in collection agency “inventory” at the end of the reporting period, along with the aging of those accounts, both by date of service and by date of placement.
- Payer Mix Analysis – Designed to identify changes or trends in the group’s payer mix, which could impact the group’s overall reimbursement rate. Percentage of charges for each major payer category are shown for each of the most recent four quarters, and compared to the most recent 12-month average, and the previous 12-month average. A sub-report also shows the same information for more detailed payer categories.
- Productivity Report – This report shows base units, time units, total cases, base and time units per case and net collections per case and per unit, for each of the most recent 12 months and the most recent 12-month average. It is by date of service, and is reported one month in arrears to allow adequate time for processing of all charge tickets for each month.
- Average units per location (for multi-location practices) – Shows total units billed by date of service and average units per nonholiday weekday for each service location. Data is shown for each of the most recent 12 months, the most recent 12-month total, and the previous 12-month total.

Summary
Reporting systems are no more than management tools, and like any other job, you must have the right tools to effectively manage a medical group. If you don’t have complete confidence in your current reporting systems, consider working with your practice managers to challenge the need for certain reports, and design new ones that give you all of the information you need in a format you can use. The group and its leadership will benefit from both the process and the end result for many years to come.
 Gregory R. Zinser, Vice President, has recently joined ABC and comes with a broad range of experience in healthcare finance and administration. Mr. Zinser’s recent experience includes four years as CEO of one of the nation’s largest anesthesia billing and practice management companies, and CEO of the management company for one of the nation’s largest anesthesia groups. With experience in all facets of anesthesia practice management, Zinser adds additional strength and depth to an ABC management team that has become the industry standard in terms of both responsiveness and quality of resources. He is a licensed CPA with an undergraduate degree in accounting with honors from the Ohio State University. Mr. Zinser can be reach at Greg.Zinser@AnesthesiaLLC.com