What is Your Cost Per Anesthetizing Location?
Jody Locke, CPC
Vice President of Anesthesia and Pain Management Services
Whether your practice is currently engaged in a hospital contract negotiation or not, it is hard to ignore the daily balancing act of scheduling available staff to best meet administration and surgeon expectations. If your practice is like most, discussions of coverage requests, new venues, and other clinical opportunities consume considerable amounts of time at group meetings. The real question is how you resolve such discussions and what criteria you use to make objective assessments of each request.

Obviously, the challenge lies in the fact that coverage and call determinations are both financial and strategic. The financial part of the equation should be the easiest part, but somehow it is not. It should be easy to determine whether the economics of a venue justify the level of coverage requested, but somehow this is the hard part. Deciding what is politically in the best interest of the practice invariably determines the outcome. This aspect often seems easier and safer. Such logic can be rather short-sighted and, too often, practices find themselves teetering on the brink of disaster because of decisions that were made months or years earlier.
Just as parents are advised not to permit what they will regret tomorrow, so too, anesthesia practice managers should remember that economics is not a discipline that respects one’s wishes. Unreasonable commitments ultimately come to haunt not only the people who made them, but the practice that has to make good on them. Successful practices have learned that the careful monitoring and management of three distinct phenomena can make all the difference. The first is revenue maximization and a detailed appreciation of all the factors that are responsible for the group’s cashflow, from managed care contracting to revenue cycle management. The second is expense management and a clear set of criteria and benchmarks for determining just how generous the practice can really afford to be to its employees. The third, and most critical, is the arcane science of cost-accounting applied to the even more obscure management of a competitive cost structure. Knowing whether the practice is appropriately staffed and what services it can reasonably be expected to provide may seem complicated; actually it is not. Like so many disciplines, this is just a matter of understanding a few key principles and knowing how to apply them judiciously.
It is the rare anesthesiologist or CRNA who does not know that he or she should be paid for the services performed; unfortunately, too few can actually establish this objectively based on the practice’s payor mix and production levels. A mastery of revenue cycle management necessarily involves an understanding and mastery of accounts receivable performance metrics. Any serious effort to benchmark a practice must begin with a careful review of the factors that create value. No serious negotiation with a hospital can ignore the need for complete and reliable management information such as unit production, payor mix, and accounts receivable metrics such as Days in AR (DAR) and bad debt percentages.
The same is true of expense management. There is no substitute for regular financial statements and an appreciation of the insidious chasm between provider expectations and the practice’s financial realities. It is curious that so many anesthesia practices eschew the notion of budget and yet, in ignoring the need to establish reasonable levels of income and expense, they leave themselves especially vulnerable to the vagaries of the market. Intuitively, all anesthesia providers know that one cannot manage what one does not measure, but somehow the application of this important business concept gets lost in the management of the practice as a whole.
It is not enough, though, to have a clear understanding of the revenue cycle, nor is it enough to manage expenses aggressively; these are relative management tools and can be very misleading without an objective reconciliation to market realities. In the atomistic world of anesthesia this can be especially intimidating. Every practice wants to believe that its situation is unique and that compensation should be commensurate with the specific services provided in the local market. While there is always some element of truth to this view, its relevance is much less significant than most are willing to admit.
Today’s successful practices understand and appreciate the concept of normalized productivity metrics. Consider the problem. Two practices provide similar coverage. One relies exclusively on physicians and the other on a leveraged care team model. Since their cost structures are so different, how does one determine what is reasonable, especially when it comes to asking for financial support from a hospital? When faced with such a problem, a growing number of consultants are now turning to a simple calculation that yields the net cost per anesthetizing location.
Table 1
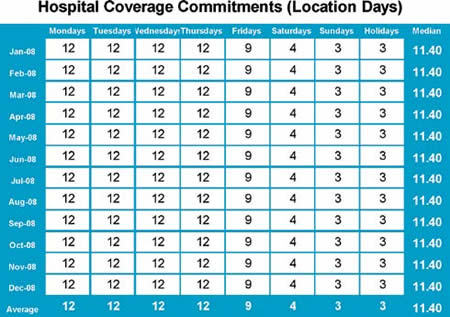
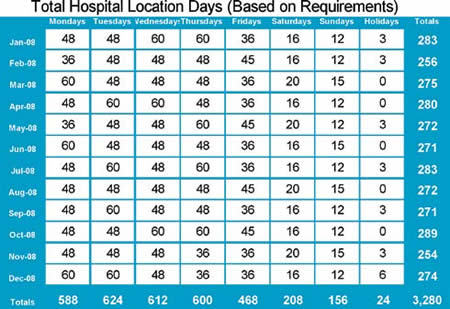
Table 2
Understanding this notion requires a disciplined view of the practice. For purposes of this discussion an anesthetizing location is defined as an actual or virtual location that requires dedicated anesthesia staffing for part or all of a 24 hour period. This will include operating rooms, delivery suites, and dedicated coverage for non-OR anesthesia (NORA). Consider Table 1 on page 4, which represents the coverage requirements of a hypothetical practice. You will note that coverage is simply defined as the number of locations that must be staffed each day of the week. For purposes of highlighting the methodology, we have used an example in which the number of rooms varies by day of the week. Some will argue that one must also consider how long each room will run and how many hours of coverage are necessary for each location. This can be a relevant enhancement to the model, but it may also complicate the analysis needlessly, especially when the objective is to use this information for an objective and meaningful comparison to other practices.
Applying this coverage map to our analysis requires multiplying each of the coverage tallies by the number of days associated with that day. In other words if there are four non-holiday Mondays in January then the total Monday coverage days equals 48 (12 * 4). Table 2 above provides a summary tally of the total location days the practice must cover in 2008, a leap year. While it is useful to know how to perform this calculation, the key to the analysis is to know the total (3,280 Hospital Location Days) for it is this number that ultimately drives all subsequent cost calculations and benchmark comparisons.
Based on the determination of total annual anesthetizing locations, it is possible to calculate both the revenue metric and the cost metric, and ultimately to work through various scenarios to balance the two.
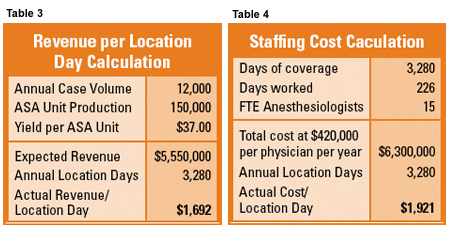
The objective of the revenue metric calculations is the establishment of the revenue per location day. This number is relatively easy to identify when one looks back in time, because actual net collections can be divided by actual coverage tallies. Doing the calculation prospectively can be a little trickier because it will require a reasonable estimate of expected collections levels. This subtle challenge notwithstanding, let us suppose that we agree the practice will collect $5,000,000 after refunds. The result would be a revenue per location day of $1,692.00, which according to the 2007 MGMA Cost survey, is close to the average cost per location day of those practices that contributed.
By most staffing models, this level of coverage would require at least 15 FTE (Full-time Equivalent) anesthesiologists in an MD only practice. Obviously, actual staffing will vary based on a variety of factors, but this is intended as a representative example for purposes of establishing a point of comparison for one staffing model versus another. Based on this assumption, the cost per location day is considerably higher than the revenue, which is an all too common phenomenon across the country and the reason why so many practices must seek financial support to maintain coverage levels.
Many an anesthesia practice will get this far in their calculation of the need for financial support and think they are ready to present their subsidy request to administration. Nothing could be more perilous. Establishing the level of support to be requested is only the first step. The calculations presented thus far only speak to the economics of coverage as viewed from the anesthesia perspective. Failure to assess the potential request from the hospital’s perspective is sure to have serious tactical, not to mention, financial repercussions.
Hospital administrators have two perspectives when it comes to hospital based physicians. They always start by asking what the current terms of the contract are and why they need to change. If the discussion survives a logical review of market factors and new coverage requests, then it moves to the second big question: why can’t the group accommodate the hospital’s requirements by modifying the way it provides the services? Administrators have come to believe in the notion of care-extenders, and often push back on the practice to “simply hire more CRNAs.” It has become almost a matter of course that hospital administrators will ask for an analysis of a more leveraged care team model. If the group does not do its homework and prepare the necessary analysis prior to the first meeting, the results are sure to be disappointing for all parties involved.
The fact is that well-managed practices should be performing the following assessments on a periodic basis. Think of mastering these financial tools as practicing for the big game. The more comfortable one gets with the basic concepts, the more reliable the analysis will be and the more adeptly it can be applied to a variety of practice scenarios, from simple coverage decisions to hospital negotiations.
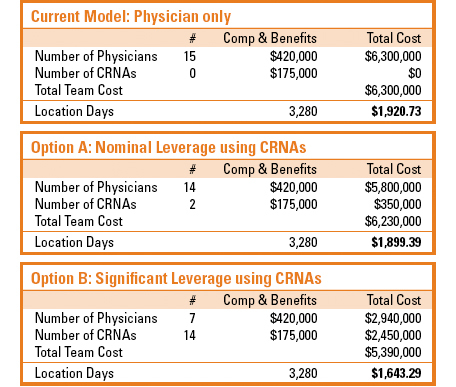
In the example in Table 5, a total annual cost per CRNA of $175,000 is used. This is actually somewhat below market, and is used here simply to highlight the argument and beliefs of hospital administrators, that it is the cost of the physicians that is creating the need for the subsidy. Two points of comparison are provided according to an assessment of reasonably equivalent staffing ratios based on a determination of FTE providers per 10,000 units billed. Option A simply highlights the financial impact of a nominal change in staffing model, while option B demonstrates the potential impact of a wholesale shift in the model. The savings of such a restructuring are significant. Of course, such an analysis fails to address the implications of actually executing such a transformation, not to mention the challenge of hiring so many new providers.
Table 5
Why is it becoming ever harder for anesthesia practices to negotiate the levels of stipend that many were obtaining so consistently even a couple of years ago? The answer has to do with three words that should be a source of great concern to anesthesia practice administrators: fair market value. This is not a consideration when a hospital employs the CRNAs. Hospitals can pay their own employees whatever they want to. They are also free to hire as many individual providers as their budgets permit.
The minute the cost of anesthesia services involves a payment to another entity, however, there is an entirely different set of guidelines and limitations. Fair Market Value (FMV) assessments are essential to compliance with Stark, anti kickback, and in some cases even the antitrust laws. Administrators and their legal counsel talk about such determinations as if they represented an objective science. The reality is much closer to the appraisal of a house where the outcome is always influenced significantly by the agent performing the analysis. Anesthesia practices should understand that FMV is the hospital’s ultimate refuge and protection from the anesthesia subsidy request.
This is exactly why the notion of anesthetizing location is so critical to the future of today’s anesthesia practices. Hospital stipends fall into three main categories: those based on a negotiated annual amount, those based on staffing requirements, and those based on coverage requirements. There is a variation on the second that will involve the identification of loss leader services such as cardiac or OB anesthesia. When it comes to negotiating leverage, the real opportunity for the typical practice lies with arrangements that provide an alignment of incentives between the hospital’s desire to maximize availability for surgeons to book cases and the cost of providing the necessary anesthesia providers to get the work done. This is where the location rate card can be played so effectively. Doing so, however, requires careful planning and preparation. As with the acquisition of many new skills and techniques, the first few times you use them you immediately come to understand how you could have used them differently and more effectively.

An understanding and appreciation of the value of anesthetizing location may not solve all the financial challenges of an anesthesia practice. In fact, it may reveal challenges and issues that practice had never even considered. What the use of such calculations does provide, however, is a form of communication that puts anesthesia practices more on a level playing field with hospital administrations, a form of common currency that allows for more effective discussion of the real challenges facing both the anesthesia practice and the hospital. If used logically and as an educational tool, such an approach will definitely change the tenor and tone of the discussion between the group and its hospital. This is not a panacea, but a tool that must be used carefully and with discipline. As anyone who has used the tool can attest, though, it is probably one of the most useful and innovative tools today’s anesthesia practices has. Whatever your situation it is hard to ignore the potential of such an opportunity.